Lighthouse architecture demystified
March 20, 2019
Intro
In one of my previous articles I explained how we can use Lighthouse to put our website on a budget and why monitoring your website performance its an important aspect of web development. In this article, we will go deeper into Lighthouse building blocks, its architecture and learn how we can start auditing and collecting custom metrics for our web pages.
Lighthouse is an audit tool developed by Google which collects different metrics of your website. After collecting the metrics it will present a series of scores for your webpage. The scoring is divided into five main auditing areas.
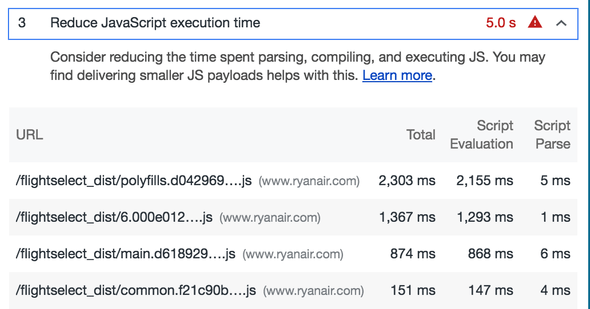
Besides the scoring of your webpage, Lighthouse provides more detailed information on where to focus your efforts, what is called “opportunities”. Areas of your website which impact may lead to big performance improvement as an example the following application execution time are quite high.
Lighthouse architecture
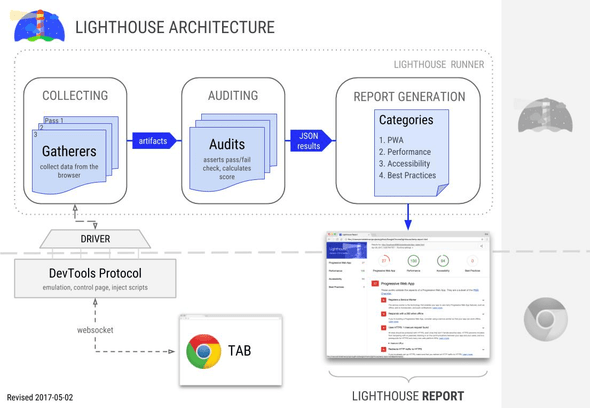
Lighthouse architecture is built around Chrome Debugging Protocol which is a set of low-level API to interact with a Chrome instance. It interfaces a Chrome instance through the Driver. The Gatherers collect data from the page using the Driver. The output of a Gatherer is an Artifact, a collection of grouped metrics. An Artifact then is used by an Audit to test for a metric. The Audits asserts and assign a score to a specific metric. The output of an Audit is used to generate the lighthouse report that we are familiar with.
We will now take a close look at two of the Lighthouse building blocks by creating a simple audit tracking the internal rendering of a webpage. Creating an application is necessary in order to include a custom Gatherer or Audit since it is not possible to add any custom Gatherer or Audit directly into the Chrome panel.
Let’s create our project and install lighthouse as a dependency
mkdir custom-audit && cd custom-audit
npm i --save lighthouse
To start auditing our website we will then create a new file scan.js where we will import Lighthouse and start scanning the webpage of choice. We will use programmatic access to Lighthouse by importing it inside our project
const lighthouse = require('lighthouse');
const chromeLauncher = require('chrome-launcher');

async function launchChromeAndRunLighthouse(url, opts, config = null) {
  const chrome = await chromeLauncher.launch({chromeFlags: opts.chromeFlags});
  opts.port = chrome.port;
  const { lhr } = await lighthouse(url, opts, config);
  await chrome.kill()
  return lhr;
}

const opts = {};

// Usage:
(async () => {
  try {
    const results = await launchChromeAndRunLighthouse('https://izifortune.github.io/lighthouse-custom-gatherer', opts);
    console.log(results);
  } catch (e) {
    console.log(e);
  }
})();
If we now try to run our file we should be able to see the results coming from a lighthouse scan in the console:
node scan.jsNow that we have a project with Lighthouse up and running we can start looking at how a Gatherer works and how we can use it in our project. We will use a webpage that I’ve created for this demo. In the page, I’m fetching todo list items from an API and rendering on the page. I’m measuring the action using PerformanceAPI as follows:
const getDataFromServer = async () => {
  performance.mark('start');
  const todos = await getTodos();
  renderTodos(todos);
  performance.mark('end');
  performance.measure('Render todos', 'start', 'end');
  const measure = performance.getEntriesByName('Render todos')[0];
}
Gatherer
A Gatherer is used by Lighthouse to collect data on the page. In fact, any data that is currently needed to perform the default lighthouse audits is collected through a Gatherer. We can extend the Gatherer base class and start creating custom ones:
const { Gatherer } = require('lighthouse');

class MyGatherer extends Gatherer {
  ...
}
The class Gatherer defines three different lifecycle hooks that we can implement in our class:
- beforePass - called before the navigation to given URL
- pass - called after the page is loaded and the trace is being recorded
- afterPass - called after the page is loaded, all the other pass have been executed and a trace is available
A lifecycle hook is expected to return either directly an Artifact or a Promise which resolve to the desired Artifact. Depending on what data are we looking to collect from the Driver and at what time we can use any of the hooks just described.
Let’s now create a custom Gatherer which will collect the measurements from the PerformanceAPI. The Gatherer needs then to collect entryType measure using a PerformanceObserver. We will proceed to create the file todos-gatherer.js
'use strict';

const { Gatherer } = require('lighthouse');


function performance() {
  return new Promise((res) => {
    let logger = (list) => {
      const entries = list.getEntries();
      window.todosPerformance = entries[0].duration
      res(entries[0].duration);
    }
    let observer = new PerformanceObserver(logger);
    observer.observe({ entryTypes: ['measure'], buffered: true });
  });
}


class TodosGatherer extends Gatherer {
  beforePass(options) {
    const driver = options.driver;
    return driver.evaluateScriptOnNewDocument(`(${performance.toString()})()`)
  }

  afterPass(options) {
    const driver = options.driver;
    return driver.evaluateAsync('window.todosPerformance')
  }
}

module.exports = TodosGatherer;
Inside TodosGatherer we are using both the beforePass and afterPass hook to contact the Driver and then execute a javascript function inside the context of the current page returning a promise. Inside the beforePass we are registering a PerformanceObserver just after the page will load, since the observers are not buffered we might encounter in a race condition. In the afterPass then we collect the previously registered measure. To get an idea of all the methods that you use on the driver object you can have a look here.
Now we need to include it in our scan.js file:
const lighthouse = require('lighthouse');
const chromeLauncher = require('chrome-launcher');

const config = {
  passes: [{
    passName: 'defaultPass', //Needed to run custom Gatherers/Audits in the same pass
    gatherers: [
      `todos-gatherer`,
    ],
  }],
}
...
If we try to run scan.js at this moment we will receive an error that there are no audits to run. A Gatherer on its own doesn’t provide any information but rather output Artifacts used on the Audits to define metrics. To proceed then we will have a look at the Audits then.
Audit
An Audit defines a metric or score, it takes the Artifacts as an input and calculates the desired score. The different audits that Lighthouse is performing such as FirstMeaningfulPaint or SpeedIndex are all in fact defined as an audit internally.
To create a custom Audit, similar to a Gatherer, we will extend a base class Audit and implements the basic methods:
To create a custom Audit, similar to a Gatherer, we will extend a
base class Audit and implements the basic methods:
const { Audit } = require('lighthouse');

class MyAudit extends Audit {
  static get meta() {
    ..
  }

  static audit(artifacts) {
    ...
  }
}
The class Audit defines two methods that need to be overridden:
- meta - used to define information about the audit
- audit - takes as input the Artifacts from Gatherers and return a Product metric.
With this information in mind, we can now implement our custom Audit and start collecting the performance of the todo list. The name of the custom audit file will be todos-audit.js and will contain:
'use strict';

const Audit = require('lighthouse').Audit;

class TodosAudit extends Audit {
  static get meta() {
    return {
      id: 'todos-audit',
      title: 'Todos are loaded and rendered',
      scoreDisplayMode: Audit.SCORING_MODES.NUMERIC,
      failureTitle: 'Todos loading is too slow.',
      description: 'Used to measure time for fetching and rendering todos list',
      requiredArtifacts: ['TodosGatherer'],
    };
  }

  static audit(artifacts) {
    const measure = artifacts.TodosGatherer;

    return {
      rawValue: measure,
      score: Math.max(1 - (measure / 1500), 0),
      displayValue: `Todos rendering is: ${measure}ms`
    };
  }
}
module.exports = TodosAudit;
Inside the method meta we are defining information describing the Audit itself such as id, title, scoreDisplayMode and description. Also, we are configuring the Artifacts which are needed by the Audit in this case TodosGatherer is the name of the Gatherer of interest.
And now we need to add it in the configuration inside scan.js similar to what we did previously to the Gatherer.
const config = {
  passes: [{
    passName: 'defaultPass’,
    gatherers: [
      `todos-gatherer`,
    ],
  }],
  audits: [
    'todos-audit',
  ],
  categories: {
    todos: {
      title: 'Todos metrics',
      description: 'Performance metrics for todos',
      auditRefs: [
      // When we add more custom audits, `weight` controls how they're averaged together.
      {id: 'todos-audit', weight: 1},
    ],
    },
  },
}
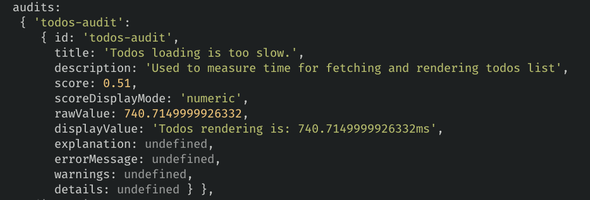
Launching now our scan we can notice our custom audit being logged into the console.
If you prefer to have the report in a different format such as HTML you can add the output option to the lighthouse function. The options object will be then used by Lighthouse to configure the running audits output format. To recap the final scan.js will look like:
const lighthouse = require('lighthouse');
const chromeLauncher = require('chrome-launcher');
const { promisify } = require('util');
const { writeFile } = require('fs');
const pWriteFile = promisify(writeFile);

const config = {
  passes: [{
    passName: 'defaultPass’,
    gatherers: [
      `todos-gatherer`,
    ],
  }],
  audits: [
    'todos-audit',
  ],
  categories: {
    todos: {
      title: 'Todos metrics',
      description: 'Performance metrics for todos',
      auditRefs: [
      // When we add more custom audits, `weight` controls how they're averaged together.
      {id: 'todos-audit', weight: 1},
    ],
    },
  },
}

async function launchChromeAndRunLighthouse(url, opts, config = null) {
  const chrome = await chromeLauncher.launch({chromeFlags: opts.chromeFlags});
  opts.port = chrome.port;
  const { lhr, report } = await lighthouse(url, opts, config);
  await chrome.kill()
  return report;
}

const opts = {
  output: 'html'
};

// Usage:
(async () => {
  try {
    const results = await launchChromeAndRunLighthouse('https://izifortune.github.io/lighthouse-custom-gatherer', opts, config);
    await pWriteFile('report.html', results)
  } catch (e) {
    console.log(e);
  }
})();
And running it now we will have an HTML report inside report.html which will look similar to the following one:
We can include also the standards Lighthouse audits together with our custom one by adding to the configuration object the following key:
const config = {
  extends: 'lighthouse:default', // Include Lighthouse default audits
  passes: [{
    passName: 'defaultPass’,
    gatherers: [
      `todos-gatherer`,
    ],
  }],
...
After the introduction to the Lighthouse architecture, we can start customising the Lighthouse audits by measuring and reporting metrics which are relevant to us. We will explore now how we can use the Gatherers to overcome a common problem while performing the scans on a CI environment.
Session guard pages
In Ryanair, we are using Lighthouse extensively to audit our webpages as part of an automated job performing scans at regular intervals and then we analyse the results of the scans on a regular basis. One of the main problems that we encountered when you are running an automated scan is how to perform audits on pages behind an authentication or user session. While with manual scans we can easily generate a session before starting the audit; if we are running Lighthouse from a CI environment we will need to generate a session programmatically and pass the information to Lighthouse.
A common approach for user session authentications management for a web application is to generate tokens, often JWT, on the server after a successful login and store the result token in the browser. You can store the token in different storage available in the browser such as LocalStorage, SessionStorage, Cookies. I will not judge here where is the best place to store a token what is interesting to us is how we can write to any of that browser storage so that Lighthouse can access the token and perform an audit.
By using a custom Gatherer we can create a user session by leveraging the lifecycle hook beforePass which triggers before the navigation to the page URL. In the hook, we call an API to generate a session and then through one of the Driver methods evaluateScriptOnNewDocument we can pass any function to be executed in the browser instance.
For the purpose of this demo, I’ve created another page where I’m basically rendering the todos only if the user is authenticated. To fake the authentication I’m checking that a specific token is present in LocalStorage and then start fetching and rendering todos.
Let’s create a new Gatherer called SessionGatherer in the file
session-gatherer.js
const { Gatherer } = require('lighthouse');

const TOKEN = 'iOiJKV1QiLCJhbGciOiJIUzI1NiJ9.eyJzdWIiOiIxMjM0NTY3ODkwIiwibmFtZSI6IkpvaG4gRG9lIiwiYWRtaW4iOnRydWUsImp0aSI6IjkzZDU0MDBiLTQ5MzgtNDNmZS1iMjY4LTY2MDJlNDIxMjFiYiIsImlhdCI6MTU1MjkwNjc0NywiZXhwIjoxNTUyOTEwMzQ3fQ.qEJflkN2ntXrQFalBkkw4duCh55HdNBLGXZOV-dS3KQ';

function createSession(token) {
  localStorage.setItem('token', token);
}

class SessionGatherer extends Gatherer {

  async beforePass(options) {
    const driver = options.driver;
    return driver.evaluateScriptOnNewDocument(`(${createSession.toString()})('${TOKEN}')`);
  }
}

module.exports = SessionGatherer;
Once we have created the gatherer we need to tell Lighthouse to include it in the list so that it will be running alongside all the other gatherers while performing an audit. We need to will create another file scan-auth.js as following:
const lighthouse = require('lighthouse');
const chromeLauncher = require('chrome-launcher');
const { promisify } = require('util');
const { writeFile } = require('fs');
const pWriteFile = promisify(writeFile);

const config = {
  extends: 'lighthouse:default',
  passes: [{
    passName: 'defaultPass',
    gatherers: [
      `session-gatherer`,
      `todos-gatherer`
    ],
  }],
  audits: [
    'todos-audit'
  ],
  categories: {
    todos: {
      title: 'Todos metrics',
      description: 'Performance metrics for todos',
      auditRefs: [
      // When we add more custom audits, `weight` controls how they're averaged together.
      {id: 'todos-audit', weight: 1},
    ],
    },
  },
}

async function launchChromeAndRunLighthouse(url, opts, config = null) {
  const chrome = await chromeLauncher.launch({chromeFlags: opts.chromeFlags});
  opts.port = chrome.port;
  const { lhr, report } = await lighthouse(url, opts, config);
  await chrome.kill()
  return report;
}

const opts = {
  output: 'html'
};

// Usage:
(async () => {
  try {
    const results = await launchChromeAndRunLighthouse('https://izifortune.github.io/lighthouse-custom-gatherer/auth', opts, config);
    await pWriteFile('report.html', results)
  } catch (e) {
    console.log(e);
  }
})();
Now we can start running our scans on the pages behind a user session and monitor their performance.
node scan-auth.jsWhich record the default Lighthouse metrics plus the custom Todos metrics which on this case are behind a user authentication.
Inside the report now if you look at the filmstrip you will notice that the todo list got rendered correctly meaning that a valid token was found in LocalStorage.
I’ve collected the examples presented here in this repository https://github.com/izifortune/lighthouse-custom-gatherer
Credits
The initial idea came by looking at the custom audit recipe from the Lighthouse team that you can find here. The recipe served as an inspiration and a first example to create a custom Gatherer/Audit. I also would like to thanks @patrickhulce for his time and prompt answers on Gitter.


